


Chicago Area Industrial Market Conditions
One of Cook County Tax Appraisals' primary areas of expertise is in the valuation of industrial properties. Our knowledge and attention to industrial submarket variations can help us identify potential errors in industrial property Chicago area assessment levels when we are completing commercial tax appraisals. With over 1.3 billion square-feet, Chicago is the largest industrial market in the nation. The region’s industrial market encompasses the entire northeastern Illinois area; with its influence extending well into northwest Indiana and southeastern Wisconsin as well. The largest concentrations are in the City of Chicago, the O’Hare International Airport area, suburban Cook County and along the major highway corridors. Cook County Tax Appraisals limits our practice to valuations of all properties to Cook County, Illinois. Chicago industrial market conditions softened due to the recession, but marked improvement is evident over the last two years. A recent article by Crain’s Chicago Business [Ori, Ryan (2013, January). Industrial Vacancy Hits Lowest Level Since 2008. chicagorealestatedaily.com. Retrieved January 28, 2013 from chicagorealestatedaily.com] reported a year-end 2012 vacancy rate at 9.5%, the lowest level since mid-2008.
Source: Colliers International Chicago Industrial Market Overview (Year-End 2011) Submarket Total Inventory Vacancy Rate Central DuPage County 84,175,674 9.89% Chicago North 90,342,780 7.16% Chicago South 84,587,011 14.44% DeKalb County 19,981,307 3.09% Elgin I-90 Corridor 28,273,823 12.01% Far South Suburbs 45,082,832 7.03% Fox Valley 89,389,701 9.17% I-290 North 76,206,830 12.91% I-290 South 45,244,723 7.93% I-39 Corridor 17,452,555 6.80% I-55 Corridor 73,022,765 11.88% I-80/Joliet Corridor 68,002,826 13.30% Lake County 70,162,219 11.15% McHenry County 30,099,848 13.36% North Suburbs 57,639,498 9.25% Northwest Suburbs 34,151,763 10.06% O'Hare 139,976,695 10.06% South Suburbs 102,024,523 10.32% Metro Chicago Total 1,155,817,373 10.38% Northwest Indiana 54,230,618 8.03% Rockford Area 51,574,970 10.84% Southeastern Wisconsin 47,731,500 6.62% GRAND TOTAL 1,309,354,461 10.16%
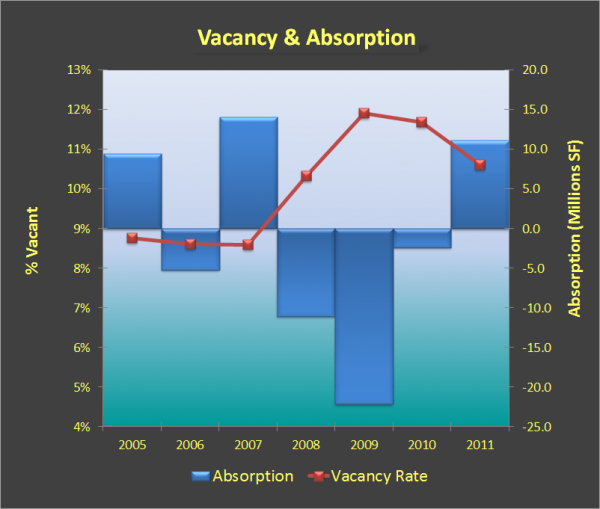
Industrial Building Space Absorption and Vacancy
Strong leasing activity contributed to a decline in the overall industrial building vacancy rate in the Chicago area. The vacant industrial inventory dropped from 159 million square-feet in 2009 to 133 million square-feet at year-end 2011. Warehousing dominated over manufacturing space absorption by almost 5 to 1, while absorption of flex buildings was negative.
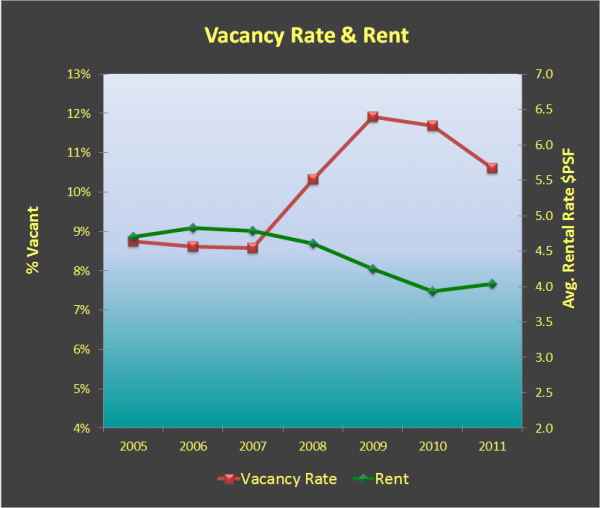
Chicago Area Industrial Lease Rates
At this point in the recovery, improvement in lease rates has been nominal; however, brokerages are reporting a reduction in the level of concessions necessary to induce new tenants.
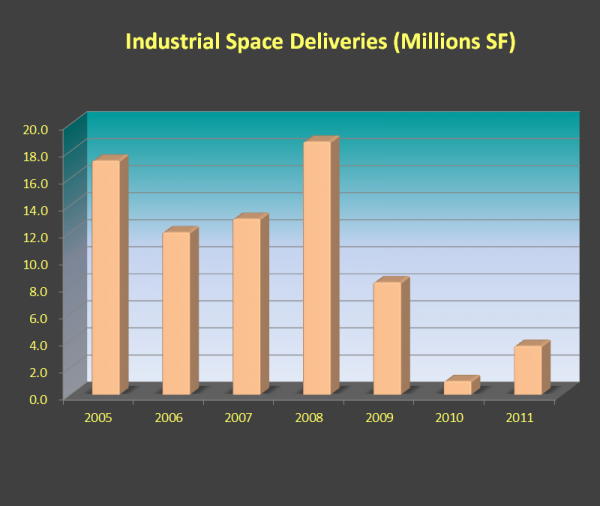
Industrial Building Space Construction in the Chicago Metropolitan Area
Build-to-suit construction continues to dominate in the aftermath of the recession. The curb on speculative construction should allow continuing moderation in overall industrial vacancy provided demand picks up as a result of sustained economic growth and increased domestic consumption. Locally, the automotive industry is improving, while the housing sector has yet to rebound.
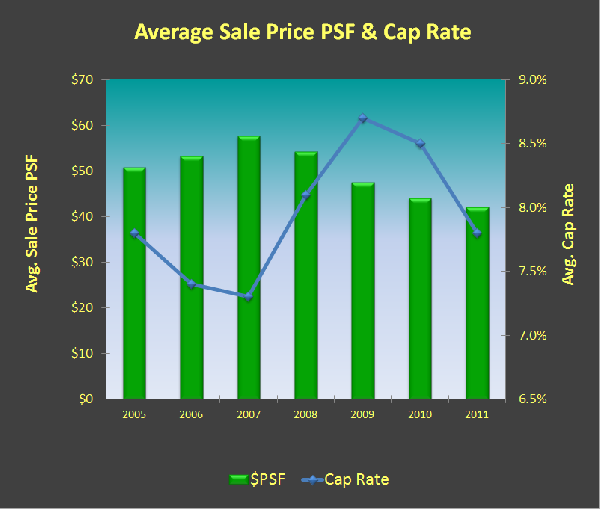
Chicago Region Industrial Building Investment Sales Trends
Industrial building investment sales in 2012 were reportedly down almost 60% from the prior year with average prices remaining flat at under $50 per square-foot.